Theoretical background
Data basis
The fundamental data basis is decribed in [Huelk2017] and its extension is detailed by [Amme2017]. Further extensions and additional details are provided in the sections below.
Definition of names introduces terms we stick to in the following text.
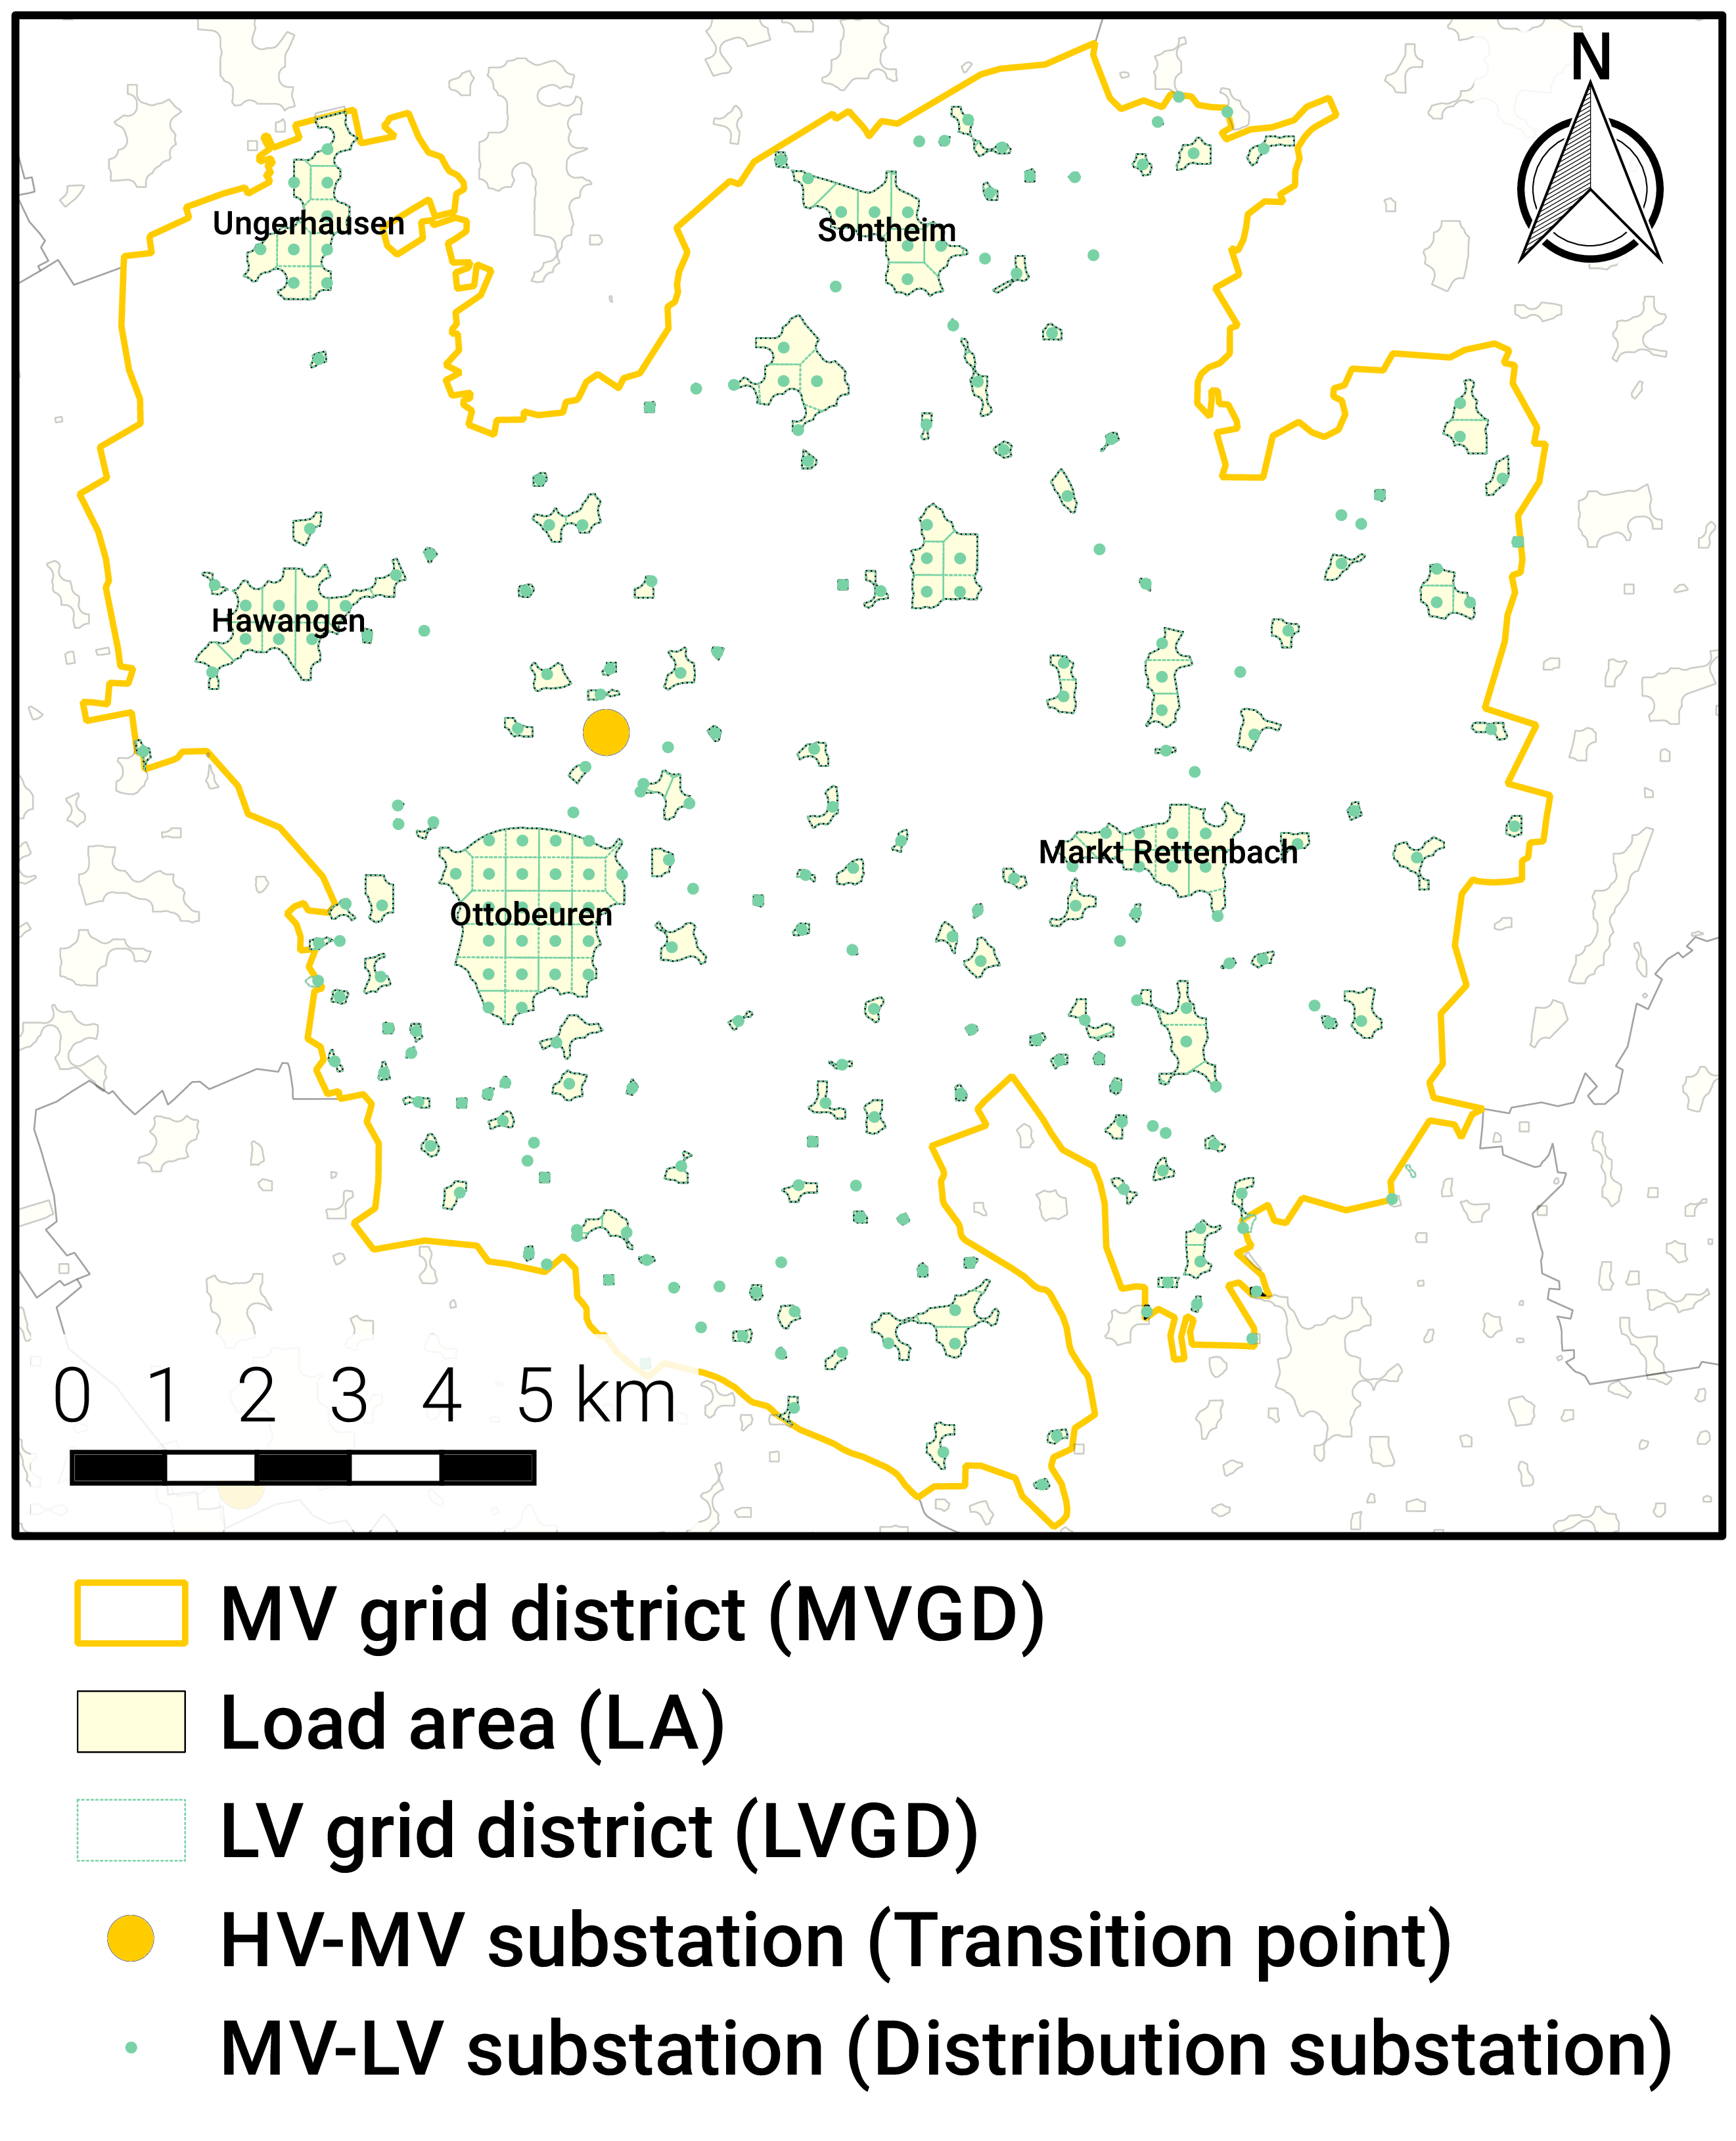
Fig. 1 Definition of names
MV/LV Substations and LV grid district
Medium-voltage/low-voltage (MV/LV) substations are located on a equidistant grid of points with an interval of 180m within the load areas. Cable length in low-voltage (LV) grids ranges from 100-1.500m (see [Kerber], [Scheffler], [Mohrmann]). According to [Scheffler], a cable length of 200 m to 300 m is most typical. Furthermore, we foud a difference between the cable length and the line over ground is 72% (1.39 Umwegfaktor), see master thesis Jonas Gütter. This seems plausible compared to the value for the MV grid of 77% (1.3). The chosen value concludes in cable lengths of 250m at the shortest distance and 283m at the longest distance between the middle point of the square and its outer line.
- Finding LV-Grid districts (LV-GD): We define Voronoi polygons within the load areas based on a grid of points with an interval of 180m.
- Assign consumption to the LV-GD: This works analogously to the methods for the MV-GD, as described in “Allocation of annual electricity consumption and power generation capacities across multi voltage levels in a high spatial resolution” (Huelk)
- Assign peak load
Medium-voltage grids
Methodological details and exemplary results are presented in [Amme2017].
Low-voltage grids
The topology of low-voltage grids is determined on the basis of typified grid models that are vastly available for the residential sector and partially available for other sector retail, industrial and agricultural. The mentioned sectors are modeled differently: the grid topology of residential sector loads founds on typified grid models from [Kerber]. Retail and industrial sector are treated as a single sector and use same methodology to determine grid topology as applied for the agricultural sector. Loads of each sector are located in separate branches - one for each sector. In the following its creation is described in detail.
However, a method to generate a representative variation of LV-grids, that can be assigned to the modeled LV/MV substations cannot be found. Given data on MV/LV substations:
- land use data divided in industry, commercial, agriculture and residential
- population
- peak load
- Define transformer
Branches of sector residential
LV-Branches
We are using the LV-Branches of Kerber from the grids. They should be assigned to the most plausible types of settlement areas.
Define the type of settlement area
To decide if a LV-grid district is most likely a rural, village or suburban settlement area we are using the population value combined with statistical data. Statisticly, there are 2.3 persons per appartment and 1.5 appartments per house. [see BBR Tabelle B12 http://www.ggr-planung.de/fileadmin/pdf-projekte/SiedEntw_und_InfrastrFolgekosten_Teil_2.pdf] [DEMIREL page 37-41, average has been coosen]. (This is not valid for urban areas.) With this we estimate the amount aus house connections (HC).
This value can also be found at the explenation of the database of the “Kerber”-grids and is assinged to the type of settlement area:
- Rural: 622 HC at 43 MV/LV substations results in an average amount of 14.5 HC/substation
- Village: 2807 HC at 51 MV/LV substations results in an average amount of 55 HC/substation
- Suburban: 4856 HC at 38 MV/LV substations results in an average amount of 128 HC/substationTher
With the resulting trendline of this three point, [the Polynomial degree 2 [ 16.127*(x^2)-7.847*x+6.1848 ] whereas x is the type of of settlement area], we difine the border values for the typ of settlement area at:
- Rural <31 HC/substation
- Village <87 HC/substation
- Suburban >=87 HC/substation
Assinging grid branches to the Substations
within the “Kerber”-model-grids several grid branches are found.
- Rural: 5 branches (with l>=78m & l<=676m)
- Village: 7 branches (with l>=102m & l<=588m)
- Suburban: 15 branches (with l>=85 & l<=610m)
Strangzuweisung Zu jeder ONS werden in Abhängigkeit von Netztyp und HA, NS-Stränge zugewiesen Eine Verteilung des Aufkommens der Stränge anhand von der Gesamtstranglänge geschieht mit Hilfe der Scheffler Angaben (Abbildung Länge der Netzstrahlen für ausgewählte Siedlungstypen [44])
- Categorising grid branches form “Kerber” model grids
Hinzu kommen auf Basis von kerber interpolierte stränge um Lücken in der Vollständigkeit zu schließen
Branches of sector retail/industrial and agricultural
Creating individual LV grid branches for the sectors retail/industrial and agricultural applies the same methodology. The topology of these grid branches determines by the sectoral peak load that is available at high spatial resolution (see [Huelk2017]). Furthermore the number of land-use areas (taken from [OSM]) of each of the sectors determines the number individual loads connected to one or more of these sectoral branches.
The topology of each sectoral branch is affected largely by assumptions on parameters that are provided in the table below.
| Parameter | Value |
|---|---|
| Max. load in each branch | 290 kVA |
Max. branch length retail/industrial  |
400 m |
Max. branch length agricultural  |
800 m |
| Length of branch stub | 30 m |
| PV peak power <= 30 kW | residential |
| PV peak power > 30 kW <= 100 kW | retail/industrial or agricultural |
| PV peak power > 100 kW | MV/LV station bus bar |
In each LV grid district (LVGD) (see MV/LV Substations and LV grid district) sectoral peak load of sectors retail+industrial and agricultural are analyzed. The number loads of each sectors determines by dividing sectoral peak load by number of land-use area found in this grid district.

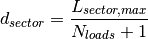
In the next step individual loads are allocated to branches considering the limit of max. 290 kVA peak load connected to a single branch. If a single load exceeds the limit of 290 kVA, it is halved until it is smaller than or equal to 290 kVA. Loads are distributed equidistant on the branches while the branch does not necessarily take the maximum length defined in the table above. The distance defines as
Single loads are connected to the branch line by stubs of a length of 30 m.
Photovoltaic (PV) power plants are allocated to different sectoral LV grid branches depending on the nominal power. The allocation by the nominal power is provided in the above table. It follows a simple assumption: smaller PV power plants are allocated to LV grid branches of sector residential, larger power plants are allocated to branches of the other sector, and really large ones are directly connected to the bus bar of the MV-LV substation.
Grid stability and equipment
During build of LV grid topology equipment is chosen with respect to max. occurring load and generation according to current grid codes (see [VDEAR]). Nevertheless, some overloading issues may remain. In addition, voltage issues may arise that can’t be considered during grid topology creation. Therefore, we adhere to the regulatory framework of [DINEN50160] which is simplified by [VDEAR]. According to [DINEN50160] voltage deviation is limited to +/-10 % of nominal that is for practical use divided into voltage drop/increase for each voltage level and the associated transformers. The allowed voltage increase in the LV grid level is limited to 3 % of nominal voltage. The allowed voltage drop is limited to 5 % as detailed in [Zdrallek].
Following steps do apply during reinforcement of Ding0 LV grids
- Checks for overloading issues at branches and MV-LV transformers first
- Critical branches (those with line overloading) are extended to appropriate size of cable to transport connected load and generation. Note, if connected load or generation capacity is still exceeding capacity of largest cable type. We keep largest available cable type and the issue most probably will remain
- Stations are tested for overloading issues for generation and load case as
well. If nominal apparent power of transformers of a substation is not
sufficient a two-step procedure is applied
- Existing transformers are extended (replaced) to comply with load and generation conencted to subsequent grid.
- If Step 1 does not resolve all issues additional transformers are build in the substation
- Subsequently over-voltage issues are analyzed for all grid nodes
- For each node where voltage exceeds 3 % of nominal voltage in feed-in case or 5 % of nominal voltage in load case, branch segments connecting the node with the substation are reinforce until no further issues remain. If a over-voltage issue cannot be solved by installing largest availabe cable (NAYY 4x1x300) this type of cable still remains as well as the overvoltage issue
- Substations are checked for over-voltage issues at the bus bar individually. Identified issues are resolved by extending nominal apparent power of existing transformer. A ultimately build up to two new transformers in the substation.
References
| [Amme2017] | (1, 2) J. Amme, G. Pleßmann, J. Bühler, L. Hülk, E. Kötter, P. Schwaegerl: The eGo grid model: An open-source and open-data based synthetic medium-voltage grid model for distribution power supply systems. Journal of Physics Conference Series 977(1):012007, 2018, doi:10.1088/1742-6596/977/1/012007 |
| [Huelk2017] | (1, 2) L. Hülk, L. Wienholt, I. Cussmann, U. Mueller, C. Matke and E. Kötter: Allocation of annual electricity consumption and power generation capacities across multi voltage levels in a high spatial resolution. International Journal of Sustainable Energy Planning and Management Vol. 13 2017 79–92, doi:10.5278/ijsepm.2017.13.6 |
| [Kerber] | (1, 2) G. Kerber: Aufnahmefähigkeit von Niederspannungsverteilnetzen für die Einspeisung aus Photovoltaikkleinanlagen, Dissertation, TU München, 2011 |
| [Scheffler] | (1, 2) J. Scheffler: Bestimmung der maximal zulässigen Netzanschlussleistung photovoltaischer Energiewandlungsanlagen in Wohnsiedlungsgebieten, Dissertation, TU Chemnitz, 2002 |
| [Mohrmann] | M. Mohrmann, C. Reese, L. Hofmann, J. Schmiesing: Untersuchung von Niederspannungsverteilnetzen anhand synthetische Netzstrukturen. In: Proceedings of VDE ETG Kongress, 2013 |
| [OSM] | OpenStreetMap contributors: Open street map, 2017 |
| [VDEAR] | (1, 2) VDE Anwenderrichtlinie: Erzeugungsanlagen am Niederspannungsnetz – Technische Mindestanforderungen für Anschluss und Parallelbetrieb von Erzeugungsanlagen am Niederspannungsnetz, 2011 |
| [DINEN50160] | (1, 2) DIN EN 50160 Merkmale der Spannung in öffentlichen Elektrizitätsversorgungsnetzen, 2011 |
| [Zdrallek] | Planungs und Betriebsgrundsätze für ländliche Verteilungsnetze – Leitfaden zur Ausrichtung der Netze an ihren zukünftigen Anforderungen, 2016 |